MTS Intelligence

How AI gets measured.

Astra scored 99.9% on ARC-AGI-3. What did it actually do? This benchmark asks a model to enter unfamiliar games, discover their rules, and learn to finish efficiently. Before unpacking the number, try one of its public environments.

GPT-6 Astra · high reasoning · Provider Adapter harness · semi-private evaluation · published 3 September 2026. ARC Prize [S56]

Opening experiment · ARC-AGI-3 / SK48

Discover the rules.

Use the arrows or click the board. Watch what changes. Discovering the goal is part of the task.

SK48Level — / 8
Starting the official ARC-AGI-3 game…
Click screen
Undo
Reset run
Help
Continue reading: what did that measure? →
01 / FOUNDATIONS

What a benchmark is

A benchmark is a repeatable measurement system. It defines what a model must do, the conditions under which it acts, what counts as success, and how many task-level outcomes become a published score.

Every move in the game is both an action and a question: what will this change? You observe the response, revise your idea of the rules, and try again. Even an unsuccessful attempt makes the task tangible: the player has to learn how this unfamiliar world works.

ARC-AGI-3 measures completion and action efficiency relative to a human baseline. It asks how much interaction a system needs to learn and solve unfamiliar environments. The number 99.9% is an aggregate evaluation result, not the percentage of intelligence a model possesses, or a score for the public game above. [S56]

That is why a benchmark is more than its questions. Its authors choose the tasks, decide which answers stay hidden, set the tools and number of attempts, and specify how individual outcomes become one number. A score answers a particular question: under these conditions, how did this system perform on this test?

ARC began in 2019 with François Chollet’s grid puzzles: study a few examples, infer the rule, and apply it to a new input. ARC-AGI-2 arrived in 2025 with new puzzles that demanded more complex combinations of rules. ARC-AGI-3 changes the format: instead of studying completed examples, you act inside a game and learn from what happens. The thread connecting them is learning an unfamiliar task from limited experience. [S59] [S07] [S60]

We’ll stay with the game to see how its worlds are built and how play becomes a score. First, where did the idea of a shared test come from?

Where the idea came from

In the 1960s, a US government reviewer named J. R. Pierce looked at the field of machine translation and concluded that its claims could not be checked. American funding for it collapsed for twenty years. [S40]

It came back in the 1980s when a team at IBM started training translation systems on the bilingual transcripts of the Canadian parliament, and—this is the part that mattered—measuring the results against a held-back set of transcripts nobody could see in advance. By the late 1980s the US defence research agency had made this the condition of funding, and hired the National Institute of Standards and Technology to hold the secret test data and do the scoring. [S40]

That arrangement has a name: the Common Task Framework. It has three parts: shared training data, competitors working on the same problem, and a referee scoring against data kept behind a wall. It produced text retrieval benchmarks in 1992, ImageNet in 2009—whose 2012 competition result set off the deep learning boom—and, eventually, the benchmarks on this page. [S40] [S43] [S44] [S45]
01 / THE BUILD

How one gets built

Someone has to design a world worth learning. ARC-AGI-3 turns that idea into games, tests them with people, and protects the environments used for evaluation.

  1. 01 / 07

    Define the capability.

    The challenge is to learn an unfamiliar world: explore, infer its rules, discover the goal, and plan a way to reach it. ARC-AGI-3 makes that learning process observable through play. [S64]

    A world you have to figure out
    ARC-AGI-3BUILD / 01
    THE SAME GAME YOU JUST PLAYEDOBSERVEACTLEARN
    Official SK48 opening frame. The labels describe the learning loop.
  2. 02 / 07

    Design a new world.

    ARC built an in-house game studio. Developers proposed concepts for review, built prototypes, and tested them internally before external playtesting. Novelty was a design requirement. [S61]

    From an idea to a playable system
    ARC-AGI-3BUILD / 02
    HUMAN-AUTHORED ENVIRONMENTSCONCEPTPROTOTYPEPLAYTEST
    The studio’s documented process; this is not a recovered SK48 design log.
  3. 03 / 07

    Make learning carry forward.

    Early levels introduce interactions. Later ones combine mechanics learned along the way, so progression tests whether the player can use what they discovered. [S61]

    The next level builds on the last
    ARC-AGI-3BUILD / 03
    KNOWLEDGE CARRIES INTO LATER LEVELS12345678DISCOVER → COMBINE → APPLY
    Schematic level progression. The numbers are editorial labels, not game instructions.
  4. 04 / 07

    Test the test.

    Automated checks look for crashes, malformed states, and accidental solutions. Replaying known action sequences checks that the environment behaves reproducibly. [S61]

    A benchmark needs reliable games
    ARC-AGI-3BUILD / 04
    CHECK THE WORLD BEFORE TESTING THE PLAYERLOAD + RUNRANDOM PLAYREPLAY + CHECK
    Schematic checks from ARC’s production pipeline, not a recorded SK48 validation run.
  5. 05 / 07

    Bring in first-time players.

    The human study involved 458 participants. Every retained environment was completed by at least two people. That establishes solvability; it does not mean every person solved every game. [S63]

    Can people discover how to win?
    ARC-AGI-3BUILD / 05
    FIRST-TIME HUMAN PLAYERS458participantsEVERY RETAINED GAME: ≥2 SOLVERS
    Study reported April 2026. Pixel figures symbolize the group, not its count.
  6. 06 / 07

    Set the human baseline.

    For each level, rank completing players by actions taken and use the upper median. With four or five finishers, that is the third entry. The reference comes from first-time play. [S62]

    Give the action count a reference
    ARC-AGI-3BUILD / 06
    ONE LEVEL · COMPLETING PLAYERS121620243220 ACTIONS → HUMAN BASELINE
    Five illustrative completions, not measured SK48 human results.
  7. 07 / 07

    Protect the evaluation.

    The April report describes 25 public, 55 semi-private, and 55 fully private games. Protected sets introduce broader mechanics. Public play demonstrates the format; it is not the official evaluation. [S61]

    The public game is the front door
    ARC-AGI-3BUILD / 07
    BENCHMARK COMPOSITION · APRIL 2026PUBLIC25GAMESSEMI-PRIVATE55GAMESPRIVATE55GAMESDEMONSTRATE EVALUATE GENERALIZATION
    Dated composition from the technical report. Astra’s result uses the semi-private set.

You have now seen the decisions behind the game: what it asks a player to learn, how its behavior is checked, and which human performance supplies the reference. The next step is turning play into a number.

01 / THE SCORE

What a score means

A benchmark score is the benchmark’s summary of a run. Follow one completed level from its action count to a human comparison, then out to the whole evaluation.

01 / 07

Start with the moves.

Return to the game you played. ARC-AGI-3 counts actions taken to complete each level, including exploration. Internal reasoning is not counted as an environment action. [S62]

Finishing has an action cost
ARC-AGI-3SCORE / 01
ONE COMPLETED LEVEL · ILLUSTRATIVE RUN40ACTIONSEXPLORE + LEARN + FINISH
Illustrative run: 40 actions to finish one level. Not your live run or a recorded SK48 result.
02 / 07

Compare with human play.

Give the level its own human baseline. In our illustrative example, that is 20 actions. The agent needed 40: twice as much interaction to finish. [S62]

Completion is only half the question
ARC-AGI-3SCORE / 02
SAME LEVEL · TWO ACTION COUNTSHUMAN BASELINE20ILLUSTRATIVE AGENT40TWICE AS MANY ACTIONS
Illustrative counts, using the baseline selection described above. Each square is one action.
03 / 07

Square the efficiency ratio.

For a completed level, divide human actions by agent actions, then square the ratio. Here, (20 ÷ 40)² = 25%. An unfinished level scores zero. [S62]

Turn the comparison into a level score
ARC-AGI-3SCORE / 03
RELATIVE HUMAN ACTION EFFICIENCY(20 ÷ 40)²25%SCORE FOR THIS LEVEL
The documented rule, applied to our illustrative counts.
04 / 07

Limit the bonus.

A completed level can earn up to 115%. This allows some credit for beating the human baseline without letting one exceptionally efficient level overwhelm the result. [S62]

A shortcut cannot dominate the test
ARC-AGI-3SCORE / 04
FASTER THAN THE HUMAN BASELINE(20 ÷ 10)² = 400%↓ CAP115%MAXIMUM PER LEVEL
Illustrative 10-action completion. The uncapped ratio is 400%; the level earns 115%.
05 / 07

Later levels carry more weight.

Level 1 has weight 1, level 2 weight 2, and so on. Scores are averaged with those weights. A completion cap prevents efficient early play from compensating for unfinished levels. [S62]

Finish seven of eight levels and the game score can reach at most 28 ÷ 36 = 77.8%.

Finishing the game matters
ARC-AGI-3SCORE / 05
EIGHT-LEVEL ILLUSTRATION · SEVEN FINISHED1234567828 ÷ 36 = 77.8%MAXIMUM GAME SCORE WITH LEVEL 8 UNFINISHED
Illustrative eight-level game. Heights show weights; the outlined level is unfinished.
06 / 07

Average across the evaluation.

Average the game scores across the evaluation set. Every game contributes; the total stays between 0% and 100%. It combines completion and action efficiency, not a percentage of intelligence. [S62]

Many games become one result
ARC-AGI-3SCORE / 06
THREE ILLUSTRATIVE GAME SCORES100%77.8%25%AVERAGE67.6%
Three made-up game results; calculation uses 28/36 before rounding. Not a model result.
07 / 07

Now return to Astra.

At high reasoning, Astra scored 99.9% with Provider Adapter and 54.8% with Standard. The harness—the software running the test—changes how information carries between actions. These are separate configured runs. [S56]

What changed between the harnesses?

The setup changes the result. ARC Prize reported Astra’s best semi-private score as 99.9% with its Provider Adapter harness and 62.7% with its Standard harness. A harness is the software that runs the model through the test. The Standard harness asks the model to preserve information in visible notes; Provider Adapter preserves private reasoning state between requests and compacts long conversations. [S56]

Those headline results use different reasoning settings: high for 99.9%, max for 62.7%. At the same high setting, the published results are 99.9% with Provider Adapter and 54.8% with Standard. The comparison concerns separate configured runs of Astra, not the same run graded twice. [S56]

The opening number describes Astra’s completion and action efficiency on the semi-private evaluation, in that setup. Your public SK48 run lets you experience the task.

Read the number with its setup
ARC-AGI-3SCORE / 07
ASTRA · SEMI-PRIVATE · HIGH REASONINGPROVIDER ADAPTERSTANDARD99.9%54.8%SAME MODEL + EFFORT · DIFFERENT HARNESSES
Published 3 September 2026. Same reasoning setting; separate runs. ARC Prize [S56].
See the complete scoring rule

Level: unfinished = 0; otherwise min(1.15, (human actions ÷ agent actions)²).

Game: weight each level by its number. Divide the weighted score sum by all level weights. Cap the result at completed level weights ÷ all level weights.

Benchmark: average the game scores across the evaluation set.

The human baseline uses the upper median of completing first-time players, separately for each level. [S62]

Example numbers in these figures are illustrative. The live SK48 action counter is not an official scorecard.

Read any benchmark score by asking four things: Which test? Which system? Under what rules? Based on how much evidence?

02 / 03

How to read a model release

Now zoom out from one score to the whole table. Follow the names, numbers, and small print in a release announcement—and learn what to look for in the next one.

01 / 06

Start with a row.

A release table compresses many different experiments into one picture. A column names the model; a row names a particular test. Start by asking what the model had to do—and what counted as success.

These selected results come from OpenAI’s official GPT-6 Astra release, checked on 17 September 2026. [S65]

One column. Several different questions.
READ THE RELEASE01 / 06
OFFICIAL RELEASE · SELECTED ROWSAstraSolFable 5.1ARC-AGI-399.9%7.8%DeepSWE v1.174.1%72.7%67.4%GeneBench Pro37.1%32.3%SRE-Bench · 4 tries99.2%68.7%Auto-review · lower ↓0%0.29%A percentage sign is not a shared unit.
Selected results from OpenAI’s official release. SRE-Bench shows the four-attempt result reported in the release text.
02 / 06

Find out what is being counted.

The same “%” can stand for different things. ARC-AGI-3 combines completion with action efficiency. SRE-Bench reports task success. A circumvention rate measures an unwanted behavior, so lower is better. [S62] [S65]

Read the scoring rule before comparing numbers. A higher percentage in one row does not make that task easier, or that capability stronger, than another.

Three percentages. Three meanings.
READ THE RELEASE02 / 06
WHAT DOES THE PERCENTAGE COUNT?99.9%ARC-AGI-3Completion + action efficiency99.2%SRE-BenchTasks solved within four attempts0%Auto-review circumventionObserved rate · lower is better
Results from the official release; meanings checked against the benchmark documentation.
03 / 06

Read the setup beside the score.

Reasoning effort, tools, prompts, time limits, and the harness can change what a model achieves. Footnotes are part of the result. OpenAI’s ARC-AGI-3 note identifies a particular harness; ARC Prize reports separate results for different harnesses and reasoning settings. [S65] [S56]

Before comparing two columns, check whether they used comparable conditions. If the setup differs, you are comparing two systems as tested—not isolating the model alone.

A score belongs to the whole setup.
READ THE RELEASE03 / 06
THE UNIT UNDER TEST IS A CONFIGURED RUNMODELEFFORTHow much reasoning?TOOLSWhat can it use?HARNESSHow does it act?MODEL + CONDITIONS → RESULT
Schematic configuration diagram. Follow a table’s footnote to the settings of the actual run.
04 / 06

Count the chances.

OpenAI reports 88.0% for Astra on SRE-Bench with one attempt and 99.2% within four. Both are useful results. They answer different questions about reliability. [S65]

“Can it succeed at least once?” is different from “Will it work on the first try?” Keep attempts, time, and cost attached to the comparison.

A retry policy can move the headline.
READ THE RELEASE04 / 06
SRE-BENCH · ASTRA · REPORTED RESULTSOne attempt88.0%Up to four attempts99.2%+11.2 percentage pointsMore chances change the measured success rate.
Reported endpoints, not a simulation. Outcomes for attempts two and three are not interpolated.
05 / 06

Treat a dash differently from zero.

A dash tells you that the table has no score in that cell. It does not tell you that the model failed every task—or, by itself, why the result is missing. Look for the accompanying explanation.

An “internal” label identifies an evaluation’s provenance. Check what task descriptions, grading rules, and results are available to inspect. Less public detail means less you can independently check; it is not a score of zero. [S65]

Absence and failure are different claims.
READ THE RELEASE05 / 06
READ THE SYMBOLS AS CAREFULLY AS THE SCORESMissing entryNo score shown in this table0%Reported zeroA measured result under this testinternalWho can inspect it?Follow the methods and evidence
A reading guide to the marks in the release table. No missing value is converted to zero.
06 / 06

Read for the work you care about.

If you are choosing a coding model, begin with coding evidence. Then ask whether the task, tools, success criteria, and resources resemble your own. A test on one kind of programming work is evidence to investigate, not a guarantee for every codebase.

The useful conclusion is specific: this system performed better on this kind of task, under these conditions. Try it on representative work before treating that result as a prediction.

Look up a benchmark →

Use the table to narrow a real choice.
READ THE RELEASE06 / 06
CHOOSE THE ROWS THAT MATCH YOUR DECISION“Will it help with my codebase?”Start with evidence about that kind of work.TASKSimilar work?TOOLSSimilar environment?SUCCESSSimilar standard?BUDGETSimilar resources?
An illustrative decision, not a recommendation of a particular model.

Read the official GPT-6 Astra release and evaluation footnotes → [S65]

03 / 03

How results become one number

A table gives you a profile. An index gives you a summary. Follow benchmark results onto Epoch’s Capabilities Index, then learn to read the dot, the error bar, and the trend.

01 / 06

Start with a performance profile.

A model has many benchmark results. A single index is a way to summarize that profile and compare models across a wider range of difficulty. Epoch’s Capabilities Index, or ECI, brings results from many tests onto one scale. [S66]

The little table is illustrative. It shows the problem an index has to solve: different tests, different levels of difficulty, and incomplete coverage.

Many results describe one model.
EPOCH CAPABILITIES INDEX01 / 06
SCHEMATIC · THREE MODELS, THREE TESTSTEST ATEST BTEST CModel A90%60%30%Model B80%50%Model C60%30%10%Different tests capture different parts of the picture.
Fictional models and percentages illustrate overlapping coverage. They are not inputs to Astra’s ECI.
02 / 06

Connect the tests through shared models.

When models take overlapping tests, their results help connect the measurements. Epoch fits a statistical model that estimates model capability together with each benchmark’s difficulty and how quickly scores rise. [S67]

ECI is therefore not a simple average of the percentages in a release table. The diagram shows the idea of a shared scale; it does not reproduce Epoch’s fit.

Overlap gives the scores a common reference.
EPOCH CAPABILITIES INDEX02 / 06
SHARED TESTS CONNECT THE MEASUREMENTSModel AModel BModel CTest ATest BTest CONE SCALEestimated capability
Schematic connections and positions. No ECI value is calculated from this illustration.
03 / 06

Read the dot in index points.

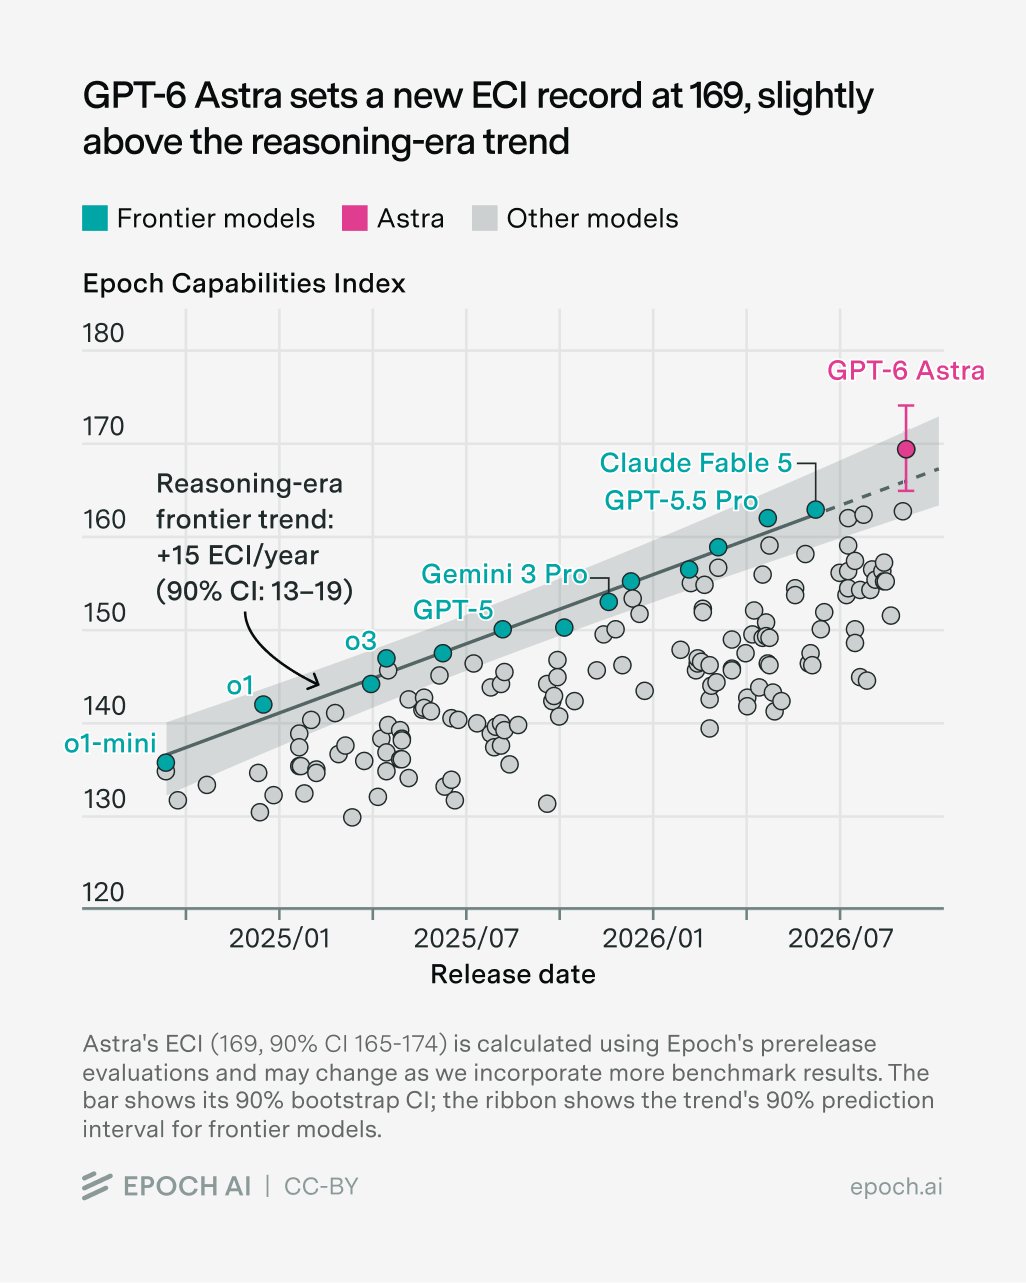
The launch chart places Astra at 169. That is a position on Epoch’s scale—not 169%, and not an IQ score. The scale has reference points rather than a fixed maximum. [S68] [S70]

A point higher up the chart represents a higher estimated capability on this index. It does not mean the model is better at every individual task.

The dot is a summary of the evidence.
EPOCH CAPABILITIES INDEX03 / 06
ASTRA · LAUNCH SNAPSHOT169index points
Original Epoch AI chart excerpt, CC BY; editorial overlay. Launch-era estimate, not a live value.
04 / 06

Keep the uncertainty attached.

In this chart, the point estimate is 169 and the reported 90% interval is 165–174. Epoch obtains its intervals by resampling the benchmark evidence and refitting the statistical model. [S67] [S70]

The bar shows uncertainty in the estimate. It is not the range of scores the model gets on different tasks. Small differences between dots need more care than a ranking alone suggests.

A precise-looking dot is still an estimate.
EPOCH CAPABILITIES INDEX04 / 06
KEEP THE ESTIMATE AND ITS INTERVAL TOGETHER17416916590%bootstrapintervalThe point alone leaves out uncertainty.
169 and 165–174 are transcribed from the historical chart. This is its bootstrap interval.
05 / 06

Separate the trend from the dot.

The line summarizes the frontier’s change over time. In this historical chart, Epoch reports about 15 ECI points per year. The surrounding ribbon is a 90% prediction interval, a different object from Astra’s own error bar. [S70]

“Above trend” compares a result with that fitted historical pattern. It does not establish a new rate of progress from one model, or guarantee what comes next.

One model and a historical trend answer different questions.
EPOCH CAPABILITIES INDEX05 / 06
FRONTIER TREND IN THIS CHART+15 ECI / yearA fitted trend, not a promise.
Original Epoch chart with an approximate editorial trace of its trend. The source image retains the actual band.
06 / 06

Use the index, then look underneath.

An index helps compare broad performance and follow progress. It compresses a profile, so models with similar overall standing can still have different strengths. Epoch also notes that specialization can be obscured by a general score. [S68]

Use the index for the broad picture. Use the individual benchmarks—and the conditions you now know to check—for a particular decision.

Find the task behind a benchmark name →Explore Epoch’s index →

A useful summary is the beginning of a comparison.
EPOCH CAPABILITIES INDEX06 / 06
ONE INDEX CAN HIDE DIFFERENT STRENGTHSSAME INDEXModel AMathCodingScienceModel BMathCodingScienceReturn to the tasks behind the summary.
Illustrative profiles only. These bars are not real models or a numerical reconstruction of equal ECI scores.
See the original Epoch chart and dated source notes

Epoch AI’s supplied launch chart reports 169 and explicitly describes the estimate as preliminary. Its model page showed 166 when checked on 16 September 2026. This walkthrough preserves the chart to explain how to read it; it is not a live ranking. ECI estimates can change as the evidence and fitted model change. [S68] [S69]

Epoch AI launch chart: Astra at ECI 169, 90 percent bootstrap interval 165 to 174, frontier trend plus 15 ECI points per year with a 90 percent prediction band.

Chart: Epoch AI · CC BY. Reader-supplied copy; original post URL not supplied. [S70]

Open the full score-reading checklist
Find a benchmark: what it tests and how it is scored
A field guide to selected benchmarksCompare what each system tests, where its tasks come from, and how it decides success.14 benchmarks
BenchmarkWhat it testsTask sourceGraderFixed / livePublic / protected
Loading benchmark records…

Descriptions summarize the dated records in this Drop. They do not compare model scores or imply that unlike benchmarks measure the same capability.

Methods

Methods, data, and sources

Open the research note, downloadable records, and complete 71-source ledger.

This is a dated editorial snapshot of measurement systems, not model marketing. Snapshot date: 26 August 2026. ARC-AGI-3 addendum: 10 September 2026, covering ARC Prize’s 3 September results. Construction, scoring, release-reading, and ECI methodology checked 16 September 2026. Earlier records retain their own dates. It prioritizes official datasets, repositories, methodology pages, evaluator records, audits, and research papers; every material claim maps to the source ledger below. Exact model versions, prompts, run dates, costs, latency, uncertainty, and retry policies are often missing, and the structured records preserve those states rather than turning them into zero. Published results are dated records, not live leaderboard queries. SK48 runs on the MTS server using ARC’s official engine and unchanged game source (sk48-d8078629). No model or external game API is called for each move. Your action count is not a benchmark score. This mode does not create official online scorecards or shareable ARC replays. Browser game state contains no credentials or scorecard identifiers. Corrections begin in the evidence and claim ledgers, then flow into the page.

71 references · accessed 26 Aug – 16 Sep 2026

Source ledger

Loading source ledger…

Result passport